2026-10-05
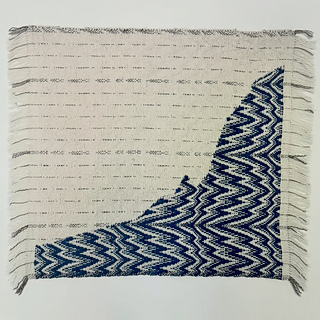
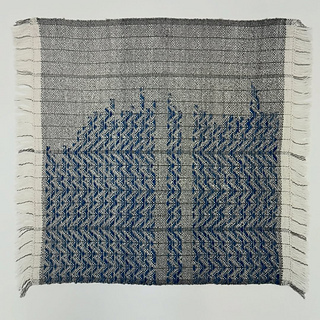
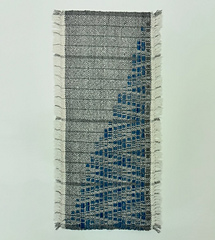
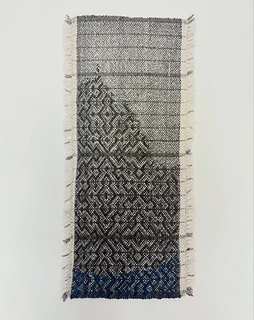
Often, humans make decisions based on the data they have. But what do the data we have truly measure? What does that mean? By slowing down, weaving each data point one at a time, I hope to reflect on what data means and what data matters.
First in a series of data visualizations:
-
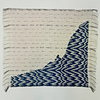
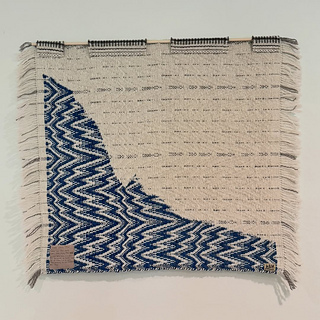
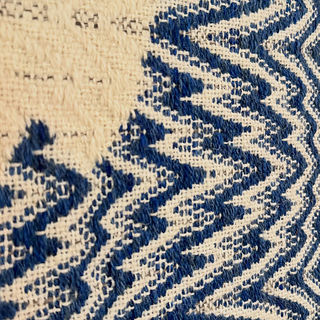
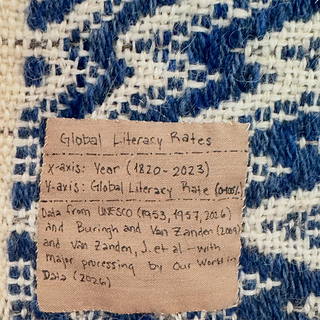
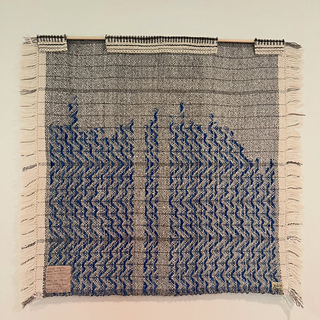
Global Literacy Rates, 1820-2023, 28x26” (photos 1-4)
-
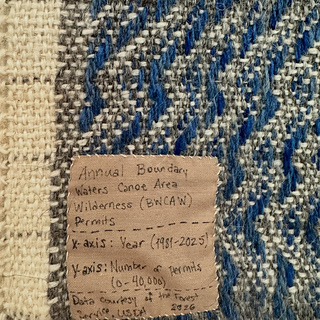
Annual Boundary Waters Canoe Area Wilderness Permits, 1981-2025, 26”x26” (Photos 5-7)
-
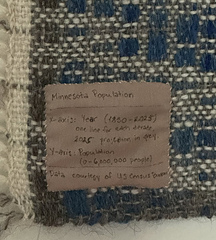
Minnesota Population, 1850-2025, 16”x26” (Photos 8-10)
-
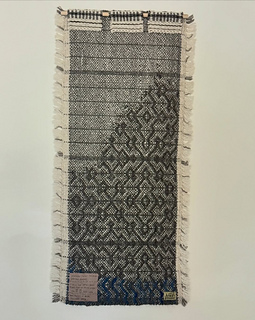
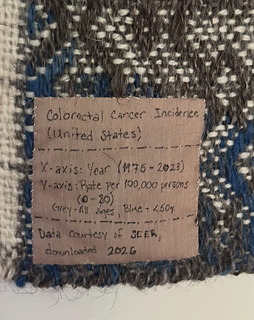
Colorectal Cancer Incidence (1975-2023), 16”x26” (Photos 11-13)
Obviously decreasing in the overall population, alarmingly spiking for those under 50.
Woven in local wool from @badgerface_fiber
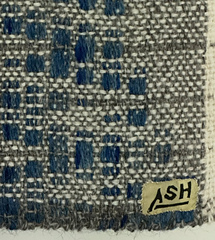
Hanging tabs also woven, but on an inkle loom. Signature block printed on silk naturally dyed with buckthorn berries.


 HarvestedHues notebook


 projects
 handspun
 stash
 queue
 favorites
 friends
 groups & events
 needles & hooks
 library
 blog posts
 Project